
The Best and Worst States for Recycling
At the America Recycles Summit back in 2020, the EPA Administrator announced the National Recycling Goal to increase the U.S. recycling rate to 50 percent by 2030. The EPA expects this goal to challenge governments, businesses, communities and individuals to improve their recycling habits. The current recycling rate across the country is a measly 32%. Recycling rates across the USA have remained stagnant for the past few years. We are in desperate need of change. In this blog post we will investigate which states are leading the way and which are falling behind.
Maine is by far the best state for overall recycling as well as glass, aluminium and PET (polyethylene terephthalate).
With an overall recycling rate of 51%, Maine’s nearby state comes in at second place.
Another state on the East coast going strong with a recycling rate of 48%, just a few points off of the 2030 goal.
We have a joint fourth place with Iowa and Oregon both having recycling rates of 45%. Oregon does have a notably good aluminium recycling rate at 82%, the highest in the country after Maine with 83%.
We have some serious improvements to make in this state with an overall recycling rate of just 4%. It seems that this state isn’t recycling many materials at all, with aluminium, glass and PPE recycling all staying under 12%.
Another Southern state appears in the bottom performers with an overall recycling rate of 5%. Aluminium recycling was better than other materials at 15% but still very low comparative to other parts of the country.
We saw an overall recycling rate of 6% in South Carolina, Mississippi and Alaska. Once again, we saw poor rates of recycling for all materials.
Only 24% of materials in the US are recycled and only 15% is recycled in a closed loop. A closed loop means a product is used and then remade into another product, keeping it from landfill. States with Recycling Refunds perform significantly better; RR states recycle 34% of material packaging through closed loop end markets compared to 7% for non-RR states.
Higher recycling rates can also be achieved through Extended Producer Responsibility (EPR). Simply put, EPR shifts the financial burden of waste management away from local governments and puts it on the producers of plastic packaging. This, alongside RR, have proved to drive up recycling rates, support closed loop recycling and maximize supply to domestic markets.
The strategy to meet the National Recycling goal is made up of 5 parts. More detail can be found on the official EPA website.
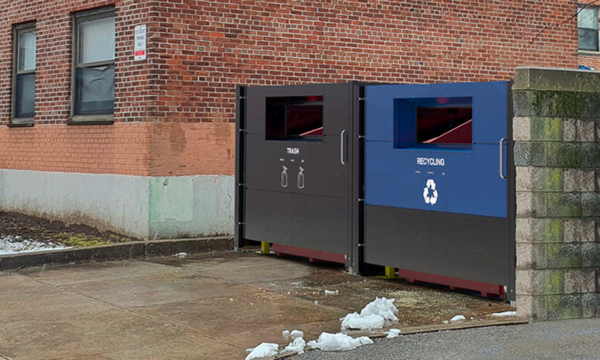
Here at metroSTOR we are proud to be working with local communities and municipalities to increase and improve recycling across the US. Easy to use, accessible bin stores are essential to making recycling easier for everyone. We look forward to being part of the change the US and planet needs.
